Block 04 · 02
Technical Analysis: When to Enter
Trend, levels, and volume: how to choose an entry point on the chart once the asset itself has passed the fundamental screen.
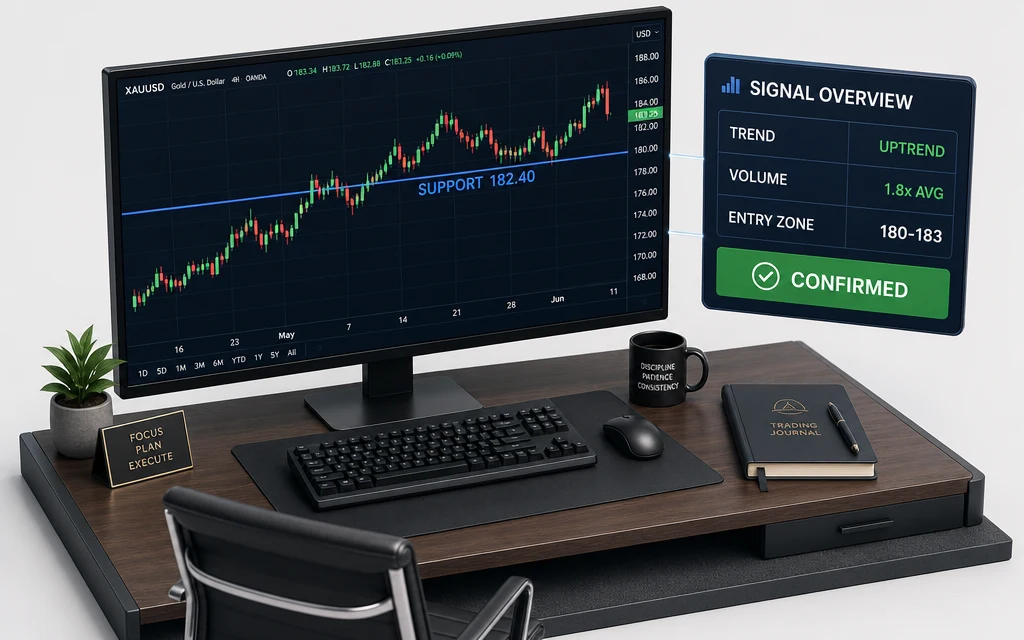
MACD and the signal line have nearly converged, but there's no cross yet. RSI is around 35 — not oversold. What do you do?
In plain words
The price has held above $118 for three months — it reached that level three times and turned up each time, with volume rising on approach. It's like a bus stop: you know where the bus reliably halts, so you wait there instead of chasing it down the street. Same asset, noticeably better entry price.
Technical analysis is about timing.
The asset is already chosen: the business is strong and the numbers check out. What's left is deciding at what price to enter. That's what the chart is for.
Three things matter for a beginner. — where the price is generally heading; it's easier to work with it. — a price the market has reversed from several times; entering near it is better value. — how much money stands behind the move; a move on heavy volume is more serious.
The practical takeaway is simple: don't buy into a vertical spike, wait for a comfortable zone, and enter in parts. That way, timing stops being guesswork.
Common beginner mistakes
- Trading against the trend without confirmation
- Judging a move without checking volume
- Entering the full size at a single point
- Using technicals detached from the fundamental screen